Visuals for Impact Reporting
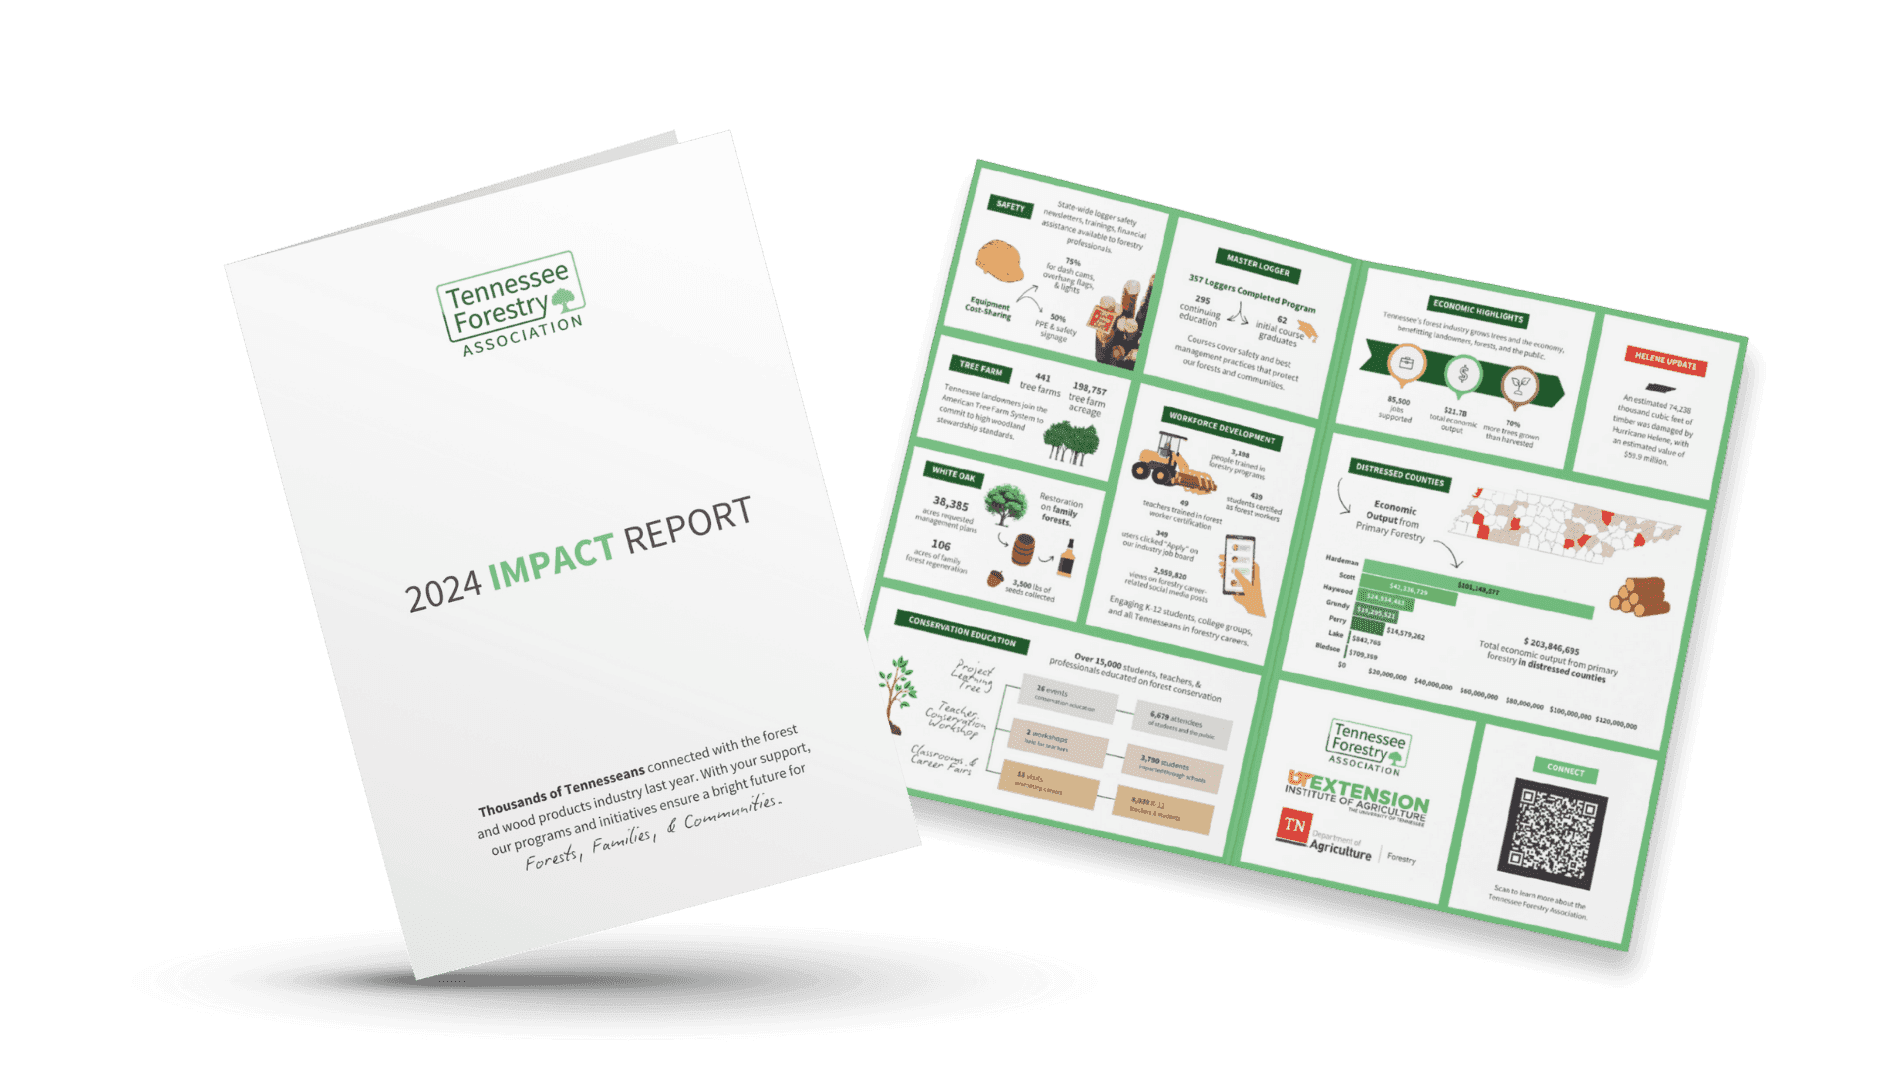
Designed visual impact reports for clients with multiple programs and varying metrics. Work includes structuring data, consulting on tracking methods, and translating information into clear, usable visuals for print and digital distribution.
Year
2022
Scope
Graphic Design
Industry
Forest Products
Status
Complete
The Challenge
Impact data is often inconsistent across programs and not stored in one place. Common issues: • Metrics tracked differently across projects • Missing or incomplete historical data • No standardized structure for reporting For this client, dozens of projects each tracked different types of metrics (reach, participation, events, etc.), making it difficult to compile accurate totals and present them clearly.
Our Strategy
Data Structure & Consulting • Advised on systems to track data consistently across projects • Focused on building cumulative, accurate records with a clear paper trail • Created frameworks that allow missing data to be added later without breaking totals Data Consolidation • Collected and organized metrics from multiple sources • Standardized formats across projects where possible • Identified gaps and worked with the client to resolve inconsistencies Visual Design • Translated data into clear, structured layouts • Prioritized readability over density • Designed for both quick summaries and deeper review Output Flexibility • Created assets for both print and digital use • Adjusted format based on how the client planned to present the data • Ensured consistency across all report formats
The Results
The final reports provide a clear, organized view of impact across multiple programs. Data that was previously scattered is now structured and usable, making it easier for the client to share results and build on them year over year. The system also improves future reporting by creating a more consistent way to track and compile metrics going forward.